
For most questions involving quadratic functions, you will want to put your equation into standard form:
f(x) = ax2 + bx + c
or its equvalent, with the appropriate variables like (x, y) or (t, y) or whatever is appropriate to the problem, for example:
y = ax2 + bx + c
y = at2 +bt + c
For equations in vertex format, you will probably want to multiply out the parentheses, simplify, and reorder the terms by decreasing powers of x before you attempt to answer questions other than ones about the vertex and whether or not the parabola opens upwards.
f(x) = a(x − h)2 + k
where the vertex is given by (h, k). Although most books call it the vertex form, some refer to it as the standard form, so be aware of potential confusion based on the textbook you are using.
You can answer most questions involving a quadratic function if you know five things about it:
- Which direction the parabola opens
- The vertical intercept
- The axis of symmetry
- The vertex
- The horizontal intercepts
You can download a handwritten pdf of a shorter summary of this page here: Quadratic Function Notes
Which direction?
1. Check a – Locate “a” in either format of the equation.
a is the coefficient; it includes the sign (positive or negative), but not the variable x2.
The larger the magnitude of a, the more narrow the parabola will be because the output will increase faster.
Of course, this also means that the smaller the magnitude of a, the wider the parabola will be.
(“Magnitude” means the absolute value – ignore the sign and look at the size fo the number.)
If a is:
|
positive, the parabola opens upward (memory aid: positive = smile |
| negative, the parabola opens downward (memory aid: negative = frown |
(Note that the coefficient “a” is the same for both the standard and the vertex forms of the equation.)
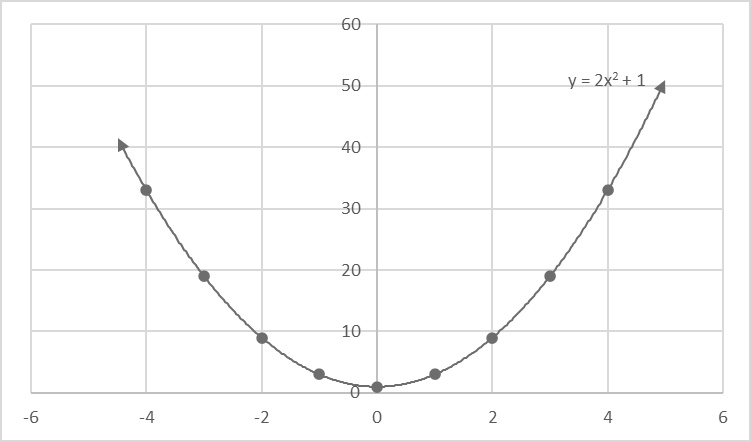
This is an example of a parabola from a quadratic equation with a positive quadratic term and no linear term. It opens upward, is symmetric around the y-axis, and the vertex is equal to the y-intercept. Notice how the vertex is also the minimum output (y) value.
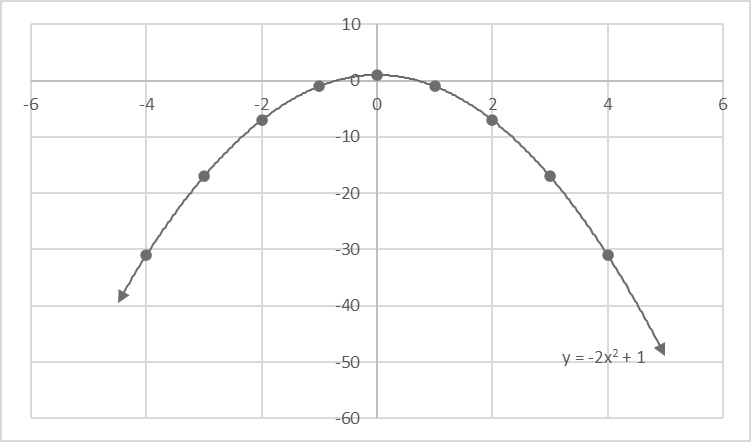
This is an example of a parabola from a quadratic equation with a negative quadratic term and no linear term. It opens downward, is symmetric around the y-axis, and the vertex is equal to the y-intercept. Notice how the vertex is also the maximum output (y) value.
Top: This is an example of a parabola from a quadratic equation with a positive quadratic term and no linear term. It opens upward, is symmetric around the y-axis, and the vertex is equal to the y-intercept.
Bottom: This is an example of a parabola from a quadratic equation with a negative quadratic term and no linear term. It opens downward, is symmetric around the y-axis, and the vertex is equal to the y-intercept.
Vertical Intercept
2. The vertical intercept, (0, c)
This is the point where the graph crosses the vertical axis (often called the output or the y-axis). Because the input value is zero at this point, the output value of c is also know as the initial value. It tells you what the output is at the beginning.
Use this to answer questions like:
- What was it at the beginning?
- How fast was it at the start?
- How tall was it originally?
and other similar questions.
The Axis of Symmetry
3. The axis of symmetry
x = −b/(2a)
This is a vertical line that cuts the parabola in half. If you place a mirror along this line, the parabola would look exactly the same.
Because this is a line, when asked for the axis of symmetry, you need to give both sides of the equal sign in response.
Not only does this give you the line of symmetry, but it is also the x (or input) value of the vertex.
The Vertex
4. The vertex, (h, k)
The vertex is the point where your graph switches direction. It answers questions like “What’s the most/largest/fastest … ?” or “What’s the smallest/least amount/slowest …?” It also cuts your work in half when graphing by hand.
To find the vertex, first find the axis of symmetry. This will give you the x-value of the vertex.
h = −b/(2a)
Then plug that x-value into the quadratic equation and solve for the y-value.
k = f(h)
You now have the complete coordinates of the vertex.
Because the parabola is symmetric around the line through this point, you can use this point to cut your work in half and to answer some questions.
How?
To cut your work in half when finding points to graph, put the vertex in the middle and step both down and up from it for inputs by the same distance to get 3 points on either side. That will give you enough to make a good sketch. Because the graph is symmetric and the step-size is the same, you only need to calculate half of the outputs; the opposite side will have the same outputs as the side you calculated. Always use symmetries when you can to make things faster and easier.
Example: for the quadratic f(x) = 2x2 + 4x − 4
h = −4/(2⋅2) = −1
k = f(h) = f(−1) = 2(−1)2 + 4(−1) − 4 = −6
so the vertex (h, k) is (−1, −6)
To find points to graph, make a table:
Remember: You only need to calculate half of the outputs. I would choose f(0), f(1), and f(2) because there aren’t extra negative signs to track and I like to minimize the work in calculations where I can, but f(−4), f(−3), and f(−2) will work just as well and give you the exact same answers.
f(−4) = f(2)
f(−3) = f(1)
f(−2) = f(0)
because of symmetry!
It doesn’t always happen, but sometimes you will get the y-intercept or an x-intercept or two when you make your table. How do we know (0,−4) is the y-intercept? Because the input (x) value is zero, and that only happens on the output (y) axis.
So, what does this look like when graphed? Let’s take a look, because the graph will also show us another useful bit of information:
The vertex gives us the minimum (lowest possible output value) or the maximum (the highest possible output value) that the function can have.
It is the minimum is the graph opens upward, and the maximum if the graph opens downward.
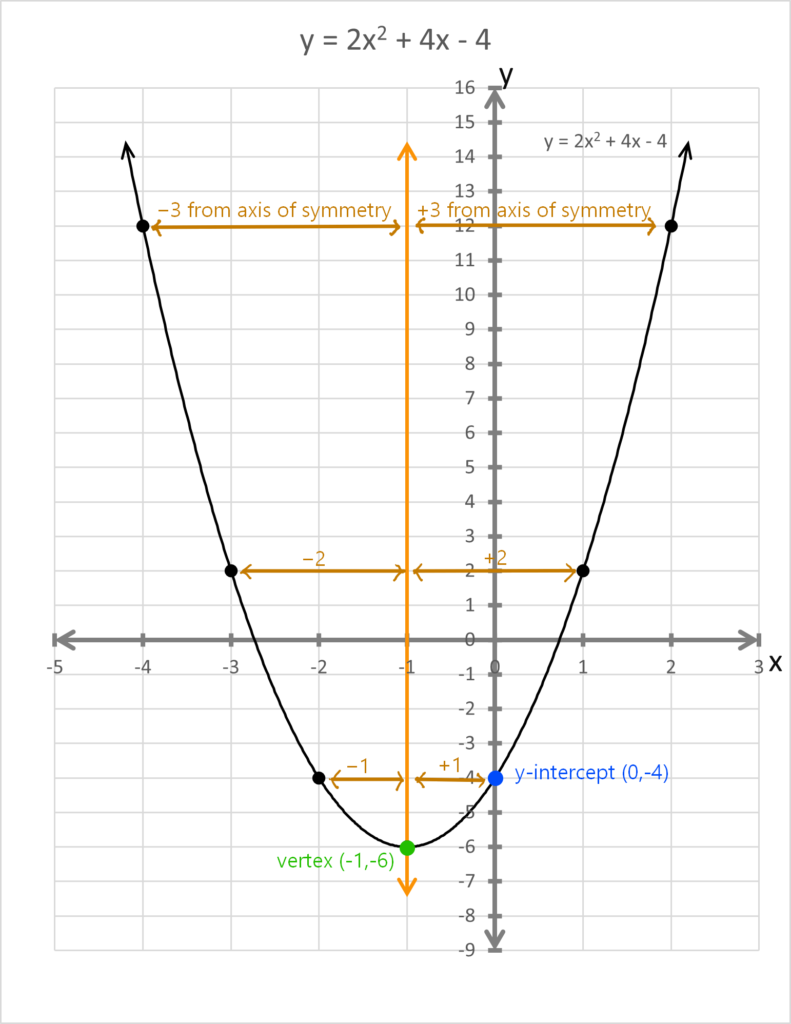
Notice how points the same distance from the axis of symmetry (x-value of the vertex) are at the same height. Graph one side, then move across to add the points for the other to let symmetry do half of your work.
Also, notice how the vertex is the lowest possible value for the output.
When you have a question about the maximum or minimum the expected answer is the y-value of the vertex.
The x-intercepts
5. The x-intercept(s), if any.
If you are asked to solve a quadratic equation, they want the x-intercepts.
The first step is to set the output equal to zero, because y = 0 on the x-axis.
There may be zero, one, or two x-intercepts, which means there can be zero, one, or two solutions. To find out whether it is worth plugging everything into the quadratic formula or factoring to find the roots, first find the
discriminate: b2 − 4ac
to find out whether or not there are any solutions.
If the discriminate is:
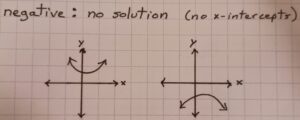
• negative, there are NO x-intercepts (no solution)
the vertex is above the x-axis and the parabola opens upward, or
the vertex is below the x-axis and the parabola opens downward
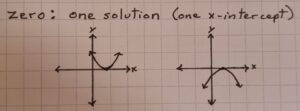
• zero, there is ONE x-intercept (one solution)
the vertex is on the x-axis so the graph changes direction at that point
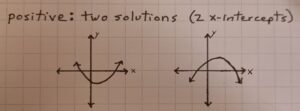
• positive, there are TWO x-intercepts (two solutions)
the vertex is above the x-axis and the graph opens downward, or
the vertex is below the x-axis and the graph opens upward
If the discriminate is zero or positive, solve for the x-intercepts either using the quadratic formula or by factoring. Because the discriminate is the part under the square root and you already solved that part in order to find out if there were any x-intercepts, you can just plug the single number into the square root of the quadratic formula, making the formula a bit easier to calculate.
The x-intercepts will then be in the format (x, 0).
They should be given as ordered pairs if you are asked for the intercepts.
Additional note: What do you do if, say, you have the equation of a projectile that gives its height (output or y) as a function of time (input or y) and you are asked to reverse things and find the time when it is at a particular height? Plug that height in place of your output variable in the original equation, move it to the other side so you have an equation equal to zero, then resolve it for the new x-intercept(s). I will do an example page for that scenario, but wanted to mention it here in case you found this page while seeking help for homework and have a problem like that.
Quadratics turn out to be very useful for things like freefall and projectile motion so expect to use them a lot if you take physics.
Here’s an example of a sketch using the 5 features listed above plus three extra points to fill in the shape.
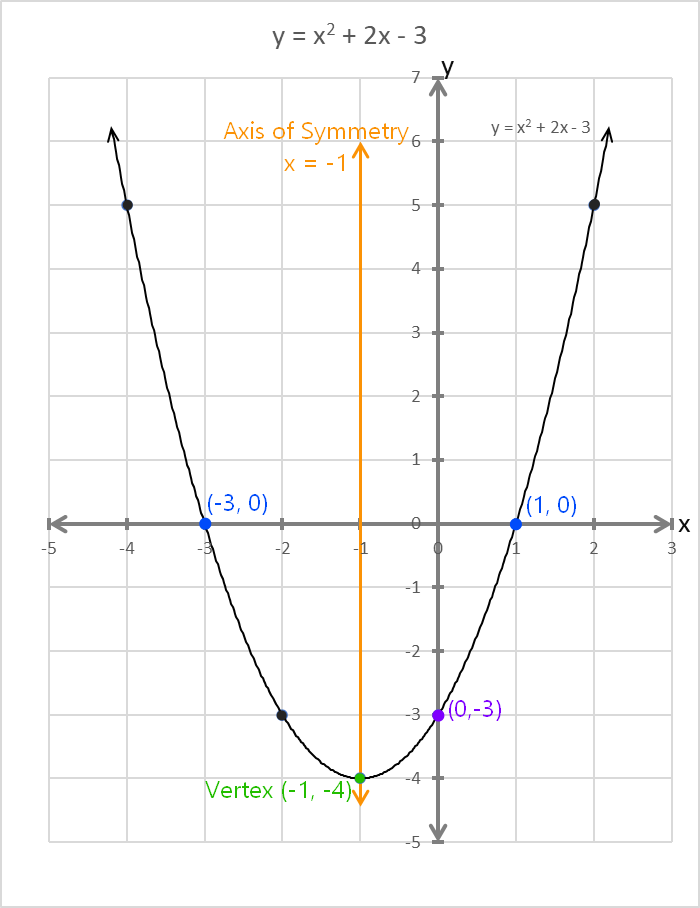
Notice how a good sketch can be obtained with the 5 features plus a couple of extra points. The point opposite the y-intercept is easily found using symmetry.
I made the graphs in Excel and then copy-pasted them into FireAlpaca to save them as jpg files.
Please let me know in the comment section below if you have any questions or ideas about what you would like to see covered, and sign up for my e-mail list for more tips and news about science and math.
